The numbers that tell you whether each sale can scale profitably
- First define the “unit” correctly, because an order, customer, subscription, or contract each tells a different financial story.
- The core math is simple: revenue per unit minus variable costs, then add acquisition cost and expected lifetime value.
- Averages can mislead. Channel mix, customer segment, refunds, and support load can change the result quickly.
- For recurring revenue models, payback period and retention often matter more than a single headline ratio.
- The fastest improvements usually come from pricing, cost control, retention, and better acquisition efficiency.
Define the unit before the math
The first mistake I see is starting with formulas before deciding what one “unit” actually is. In practice, the right unit is the smallest repeatable thing that creates revenue and can be measured cleanly enough to guide decisions. For an online store, that is usually one order. For a SaaS business, it is often one customer account. For a service firm, it may be one project or retainer. For a marketplace, it might be one completed transaction or one active seller, depending on where the money really moves.
That choice matters because the economics change with the unit. If I track orders for an e-commerce brand, I care about shipping, packaging, payment fees, returns, and discounts. If I track customers for a subscription business, I care more about churn, onboarding cost, support load, and how long the account stays active. Use the wrong unit and the model can still look polished while telling you the wrong story.
| Business model | Practical unit | Why it works | Common trap |
|---|---|---|---|
| E-commerce | Order | Each order has measurable product, shipping, and return costs. | Mixing fixed overhead into per-order cost. |
| SaaS | Customer account | Recurring revenue and churn define the relationship. | Using raw revenue without margin or retention. |
| Agency or professional services | Project or retainer | Labor, utilization, and scope are the real drivers. | Ignoring non-billable time and revision cycles. |
| Marketplace | Completed transaction or active seller | Take rate, incentives, and liquidity matter by side of the market. | Blending buyer and seller economics into one average. |
Once the unit is defined, the next step is deciding which numbers belong in the model and which should stay outside it.
The metrics that matter most
At the core, I want to know three things: how much revenue each unit brings in, how much it costs to serve that unit, and how much it costs to acquire it. From there, the model becomes a question of balance rather than guesswork. The most useful metrics are usually revenue per unit, variable cost per unit, contribution margin, customer acquisition cost, lifetime value, and payback period.| Metric | Simple formula | What it tells you |
|---|---|---|
| Revenue per unit | Price or average revenue per sale | How much cash the unit brings in before costs. |
| Variable cost per unit | Direct costs that rise with each sale | What it costs to fulfill, deliver, or support that unit. |
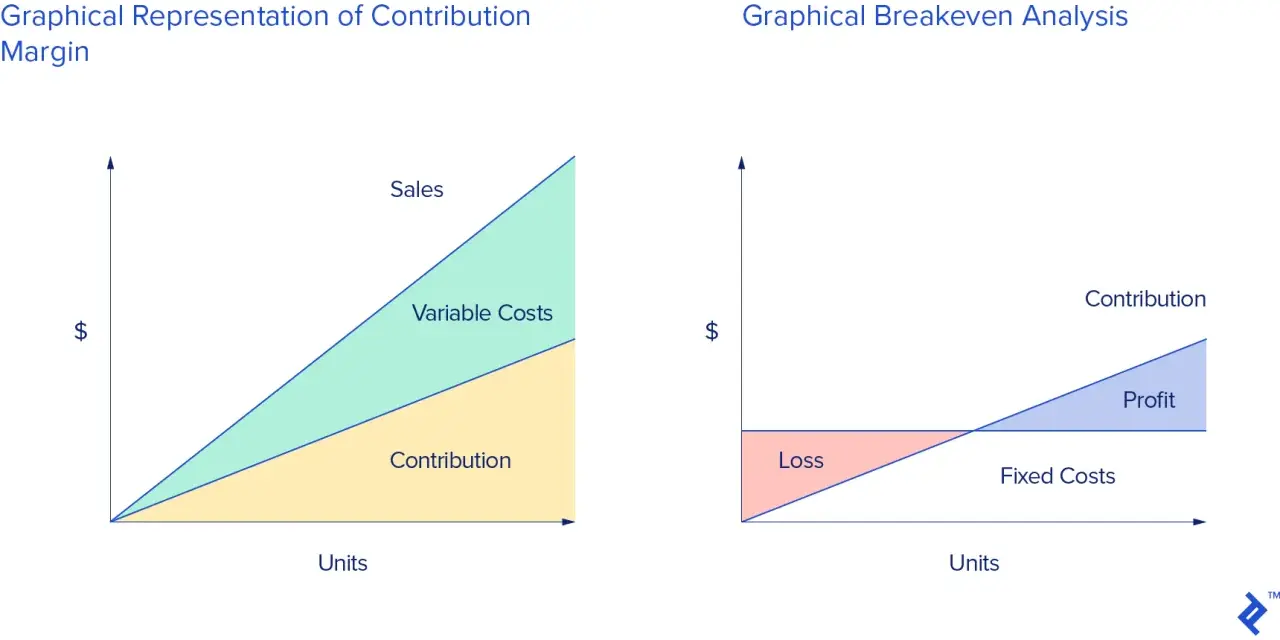
| Contribution margin | Revenue per unit - variable costs | What remains to cover acquisition and overhead. |
| Customer acquisition cost | Total sales and marketing spend / new customers | How expensive it is to win one customer or equivalent unit. |
| Lifetime value | Gross profit per period x expected lifetime | How much value the relationship generates over time. |
| Payback period | Acquisition cost / monthly gross profit | How long it takes to recover the acquisition spend. |
I prefer gross profit over raw revenue when I compare lifetime value, because revenue alone flatters the result. If a customer brings in $1,000 over their lifetime but only $400 is left after direct costs, the business cannot spend like that full $1,000 is available. That simple adjustment prevents a lot of optimistic forecasting.

How I calculate it step by step
When I build the model, I keep it simple first and only add detail when the business model demands it. A clean first pass is usually enough to show whether the economics work.
- Define the unit. Decide whether you are measuring an order, customer, subscription, contract, or project.
- List direct revenue. Use actual selling price, not the number you hope to charge later.
- Collect variable costs only. Include product cost, freight, transaction fees, commissions, cloud usage, labor tied directly to delivery, or onboarding costs that scale with the unit.
- Calculate contribution margin. Subtract variable costs from unit revenue.
- Add acquisition cost. Include paid media, sales salaries, commissions, outbound tooling, and other costs needed to win the unit.
- Estimate lifetime value. Use historical retention or repeat purchase behavior, not wishful thinking.
- Check payback and ratio. If the relationship is strong enough, the business can usually scale with more confidence.
Two quick examples make the logic clearer. A consumer brand might sell an $80 order, spend $34 on product, $7 on shipping, $4 on payment fees, and reserve $5 for returns. That leaves a $30 contribution margin before acquisition cost. If CAC is $18, the first order still leaves $12 to help cover overhead and future growth. A subscription company charging $49 per month with $9 in variable delivery cost has $40 in monthly gross profit. If monthly churn is 4 percent, a rough lifetime value is about $1,000 in gross profit, and a $250 CAC produces a 4:1 ratio.
That is the practical use of the model: it converts a vague growth story into a cash story, which makes the next question much easier to answer.
How I read the result without fooling myself
There is no universal benchmark that works for every business, but there are patterns I trust more than others. A commonly used rule of thumb in subscription businesses is a 3:1 lifetime value to acquisition cost ratio, yet I treat that as a directional signal, not a law. The payback period often matters even more, because a strong ratio does little good if the company runs out of cash before it gets paid back.
I also separate the business by channel and cohort. One acquisition source can look excellent while another quietly destroys margin. One customer segment can retain well while another churns out after the first month. If I only look at company-wide averages, I usually see a comfortable number that hides a weak corner of the business. That is why I care about segment-level reporting, not just the headline dashboard.
- Healthy contribution margin but slow payback means the model may work, but growth needs discipline.
- Strong lifetime value but rising CAC usually means the best channels are getting saturated.
- Good average economics with poor new cohorts usually means the underlying business is deteriorating.
- High gross margin with heavy support costs usually means part of the real cost base is hidden elsewhere.
If I had to choose one sanity check, it would be this: can the company explain why the numbers are improving or weakening by channel, segment, and time period? If not, the model is probably too coarse to guide real decisions.
Where the model usually breaks
The fastest way to get a false sense of security is to overstate revenue and understate cost. I see the same mistakes again and again, and they are usually more damaging than minor formula errors.
- Using revenue instead of gross profit. Revenue may grow while the actual value kept by the business shrinks.
- Mixing fixed and variable costs. Office rent and executive salaries do not belong in every unit if they do not scale with each sale.
- Ignoring refunds, chargebacks, and cancellations. These can distort the picture quickly in consumer and subscription models.
- Underestimating service and support load. A product that looks cheap to deliver can become expensive once onboarding and assistance are included.
- Blending different channels together. Paid search, referrals, partnerships, and outbound sales rarely have the same economics.
- Projecting lifetime value from too little history. Early data can be useful, but it is not a durable forecast by itself.
There is also a governance issue here. If the finance team, sales team, and operators define costs differently, the dashboard becomes a debate instead of a decision tool. I prefer one documented definition of every metric, reviewed on a fixed cadence, so the company is not arguing about math while the market is moving.
How I improve the economics of each sale
When the numbers are weak, I usually do not start by chasing more volume. I start by asking which lever will improve the economics fastest without breaking the business model.
| Lever | Typical impact | Main tradeoff |
|---|---|---|
| Pricing | Immediate lift in margin if demand holds | Conversion can fall if the increase is too aggressive. |
| Variable cost reduction | Direct improvement in contribution margin | Cheaper inputs can hurt quality if managed poorly. |
| Retention | Larger lifetime value over time | The payoff is slower than a price change. |
| Acquisition efficiency | Lower CAC and faster payback | Some low-cost channels scale only so far. |
In practice, I would usually look at pricing first, then variable costs, then retention, and only then volume. Price changes are fast, but they need discipline. Cost reductions can be powerful, but they should not degrade the customer experience. Retention improvements take longer, yet they often produce the best long-term return because they lift lifetime value while spreading acquisition cost over a longer relationship. For subscription businesses, annual contracts, onboarding quality, and product adoption often matter more than another small spend increase.
What strong unit economics really look like before scaling
When I see a business ready to scale, I look for a few things working at the same time: positive contribution margin, a payback period that fits the company’s cash position, and retention that holds up across cohorts rather than only in the blended average. I also want the leadership team to know which customer types are worth chasing and which should be left alone.
Good economics are rarely an accident. They come from consistent measurement, clear ownership of pricing and acquisition decisions, and enough operational discipline to keep hidden costs from creeping into every sale. If those controls are in place, growth becomes a lever. If they are not, more volume usually just makes the losses louder.
My rule is simple: review the numbers monthly by channel and segment, not just at the company total. The average can tell you whether the business is alive, but the detail tells you whether it can actually get stronger.