Strong startup KPIs are not about filling a dashboard. They are about showing whether a new business is learning fast enough, selling efficiently, and preserving enough cash to reach the next milestone. In this article, I break down the financial and operating metrics that matter most, how I choose them by business model, and how I avoid the usual trap of mistaking activity for traction.
The numbers that matter most are the ones tied to cash, growth quality, and survival
- Start with cash balance, monthly burn, runway, and gross margin before chasing growth vanity.
- Use CAC, LTV, churn, and conversion to test whether growth is actually efficient.
- Match the scorecard to the business model instead of copying another startup’s dashboard.
- Review cash weekly, operating metrics monthly, and strategy quarterly.
- A KPI only matters if it changes a decision.
Which metrics matter first in an early-stage company
At the earliest stage, I want a small scorecard, not a science project. Before revenue, I care about whether the company can survive long enough to learn from the market, and after revenue starts, I care about whether growth is worth paying for.
Before revenue
When the business is still pre-revenue or just starting to monetize, the goal is survival and signal quality.
- Cash balance tells you how much time is left to learn, hire, and sell.
- Monthly burn shows how quickly you are spending cash net of inflows.
- Runway tells you how many months you can operate before cash runs out. As a working rule, I like to see at least 12 months of runway, with 6 to 9 months already in the warning zone.
- Lead quality shows whether early demand is real or just curiosity.
- Activation rate shows whether people reach first value after sign-up, demo, or onboarding.
Read Also: FDIC Insured Deposit Sweep - Is Your Cash Truly Safe?
After revenue starts
Once customers are paying, the question changes from survival to efficiency. A business can still grow while being unhealthy if each new customer costs too much or disappears too quickly.
- Gross margin shows how much revenue is left after direct costs.
- CAC shows what you spend to win a customer.
- LTV shows the value a customer should generate over time.
- Churn or repeat purchase rate shows whether customers stay long enough to create a return on acquisition spend.
- Payback period shows how long it takes to recover acquisition cost from gross profit.
Once you know the stage, it becomes much easier to decide which financial numbers deserve the most attention, and that leads straight into the actual math behind the dashboard.
The financial KPIs I would track first
These are the metrics that tell me whether the company can survive and whether growth is worth funding. The SBA’s planning tools are useful here because they force revenue, expenses, and cash flow into the same conversation instead of treating cash as an afterthought.
| Metric | What it tells you | Simple formula | How often I review it |
|---|---|---|---|
| Cash balance | Immediate survival and how much room you have to learn | Bank cash on hand | Weekly |
| Monthly burn | How fast cash is leaving the business | Cash outflow minus cash inflow | Weekly |
| Runway | How many months you can keep operating | Cash balance divided by net monthly burn | Weekly |
| Gross margin | How much revenue remains after direct delivery costs | (Revenue minus COGS) divided by revenue | Monthly |
| CAC | How expensive it is to acquire one customer | Sales and marketing spend divided by new customers acquired | Monthly |
| LTV | How much value a customer should create over time | Average gross profit per customer multiplied by expected lifetime | Quarterly |
| Break-even point | The sales level required to cover fixed costs | Fixed costs divided by contribution margin | Monthly or quarterly |
If I had to keep only three numbers on the wall, I would choose cash balance, burn, and runway. YC’s advice on runway is blunt for a reason: revenue, burn, and runway should be numbers you know without hunting through a spreadsheet. For U.S. founders, that trio also speaks the language lenders and investors expect, because it connects today’s cash to tomorrow’s obligations.
Gross margin and CAC then tell me whether growth is being bought at a sane price, while break-even tells me how far the company is from not needing outside money just to keep the lights on. Those figures explain survival, but they do not yet tell you whether growth is healthy, which is where operating metrics matter.
The operating metrics that explain whether growth is real
Financial metrics tell you if the business is alive. Operating metrics tell you whether it is learning. I look for the few signals that explain why revenue is moving, not just whether it moved.
| Metric | Why I care | What usually goes wrong |
|---|---|---|
| Conversion rate | Shows how well traffic, leads, or demos become customers | More traffic hides weak positioning or a broken sales funnel |
| Activation rate | Shows whether new users reach first value quickly | Sign-ups rise while actual usage stalls |
| Retention or repeat purchase rate | Shows whether the product creates habit and value over time | Acquisition looks good while cohorts decay fast |
| Churn | Shows how much recurring revenue leaks out each period | Sales keep replacing lost customers instead of compounding growth |
| Sales cycle length | Shows how long it takes to turn interest into cash | Pipeline forecasts become optimistic and unreliable |
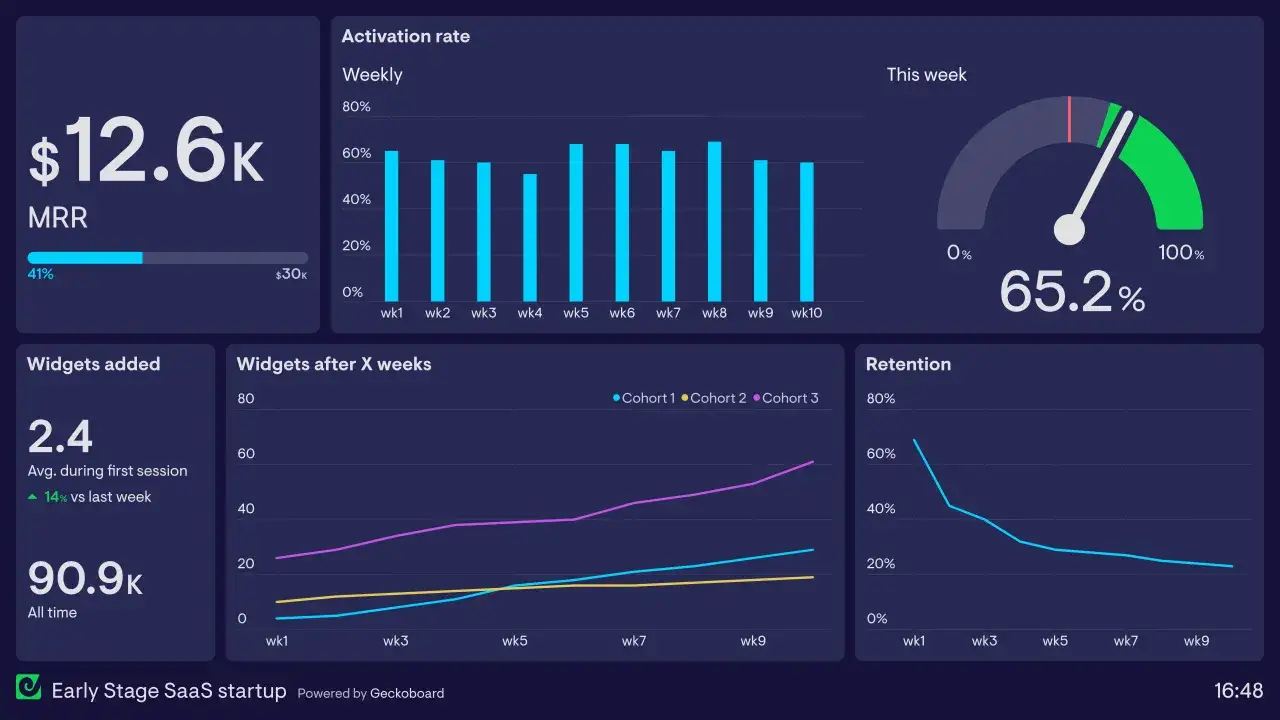
I prefer cohort views over simple averages whenever I can get them. Averages smooth out the sharp edges, but cohorts show whether each customer group is improving or fading. That matters because one good month does not erase three weak cohorts, and the business model determines which cohort patterns matter most.
How I choose startup KPIs by business model
The right dashboard depends on what the company actually sells. A SaaS business, an e-commerce brand, a services firm, and a marketplace can all have strong revenue and still need very different scorecards.
| Business model | Primary KPIs | What I watch for first |
|---|---|---|
| SaaS | MRR, ARR, churn, NRR, CAC payback, activation | Whether retention and payback support growth, not just whether sign-ups are rising |
| E-commerce | Conversion rate, average order value, gross margin, repeat purchase rate, return rate | Whether paid traffic is profitable after product and fulfillment costs |
| Services | Billable utilization, realization rate, project margin, days sales outstanding, pipeline coverage | Whether delivery capacity and collections can keep pace with sales |
| Marketplace | Liquidity, fill rate, take rate, buyer retention, seller retention | Whether both sides of the market are active enough to create repeat usage |
If your model is hybrid, I would not force it into a pure SaaS or pure e-commerce template. I would track the metrics that reflect the biggest constraint, because that is usually where the business breaks first. For software-led companies, burn multiple and the Rule of 40 become useful later, but they should never replace survival metrics in the first phase.
How to build a dashboard you will actually use
Dashboards fail when they become reports nobody owns. I prefer three rules: one source of truth, one owner per metric, and one action attached to every number that matters.
- Weekly for cash balance, burn, runway, collections, and pipeline health.
- Monthly for revenue, gross margin, CAC, payback, churn, and retention.
- Quarterly for cohort analysis, budget variance, and scenario planning.
- Alert on drift if a metric moves by 10% or more from plan, or changes direction for two periods in a row.
- Keep it small with no more than 10 core numbers on the main screen.
I also like to separate charts from tables. Charts make trend visible at a glance, while tables force accountability on the exact numbers behind the trend. That structure keeps the dashboard readable, and it also makes the common mistakes easier to spot.
The mistakes that make metrics misleading
Most bad dashboards do not fail because of missing data. They fail because the wrong data is being treated as decision-making truth.
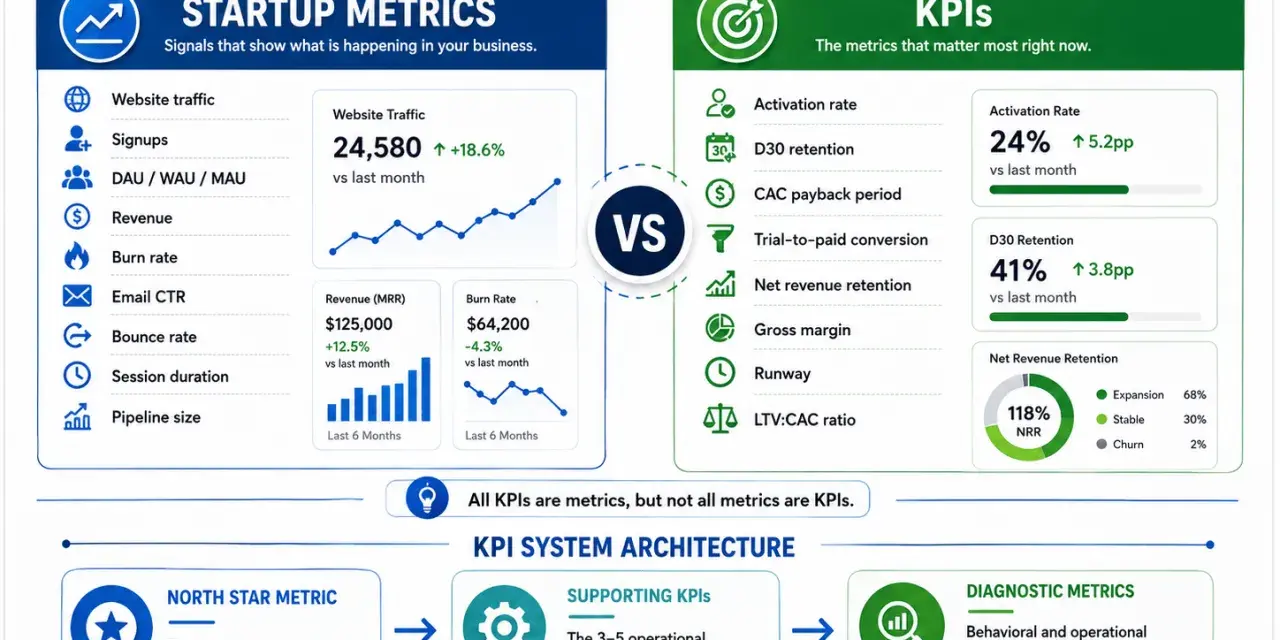
- Vanity metrics like traffic, downloads, or social followers look impressive but do not prove revenue quality.
- Mixed definitions create confusion when teams use different meanings for active user, customer, or revenue.
- Averages without cohorts hide whether new customers are better, worse, or just different from earlier ones.
- Ignoring cash timing makes profitable businesses look healthier than they are when collections are slow.
- Copying the wrong benchmark leads founders to compare themselves with companies at a different stage or in a different model.
- Overreacting to one month can cause noise; I want to see a pattern before I call it a trend.
The point is not to measure less. The point is to measure what changes behavior, because that is what turns data into management.
The weekly review that keeps the business honest
If I were joining a new business tomorrow, I would run the same short review every week and keep it brutally practical. The goal is not to admire the numbers, but to decide what has to change before the next meeting.
- Check cash balance, burn, and runway first.
- Compare revenue, margin, and collections with the plan.
- Review one acquisition metric and one retention metric in context.
- Pick one operational fix, then assign an owner and a deadline.
That rhythm is simple, but it usually exposes the difference between a business that is growing and a business that is merely spending. If the dashboard keeps leading to sharper decisions, the metrics are doing their job, and that is the standard I would use for any early-stage company.