The fixed vs variable costs split is one of the first things I check when a budget stops making sense. If you know which expenses stay stable and which rise with output, you can price more confidently, set realistic break-even targets, and spot where margins are leaking. I’ll walk through the distinction in plain English, then show how it affects accounting decisions, mixed costs, and the mistakes that usually distort the numbers.
What matters most at a glance
- Fixed costs stay roughly unchanged in the short run, even when output moves up or down.
- Variable costs rise and fall with production, sales volume, shipments, or another measurable driver.
- The split matters most for pricing, budgeting, break-even analysis, and margin planning.
- Many real-world expenses are mixed costs, not perfectly fixed or perfectly variable.
- The right classification depends on the relevant range, meaning the output band where your assumptions still hold.
- A clean cost model is useful only if it matches actual invoices, payroll, and volume changes.
How cost behavior works in accounting
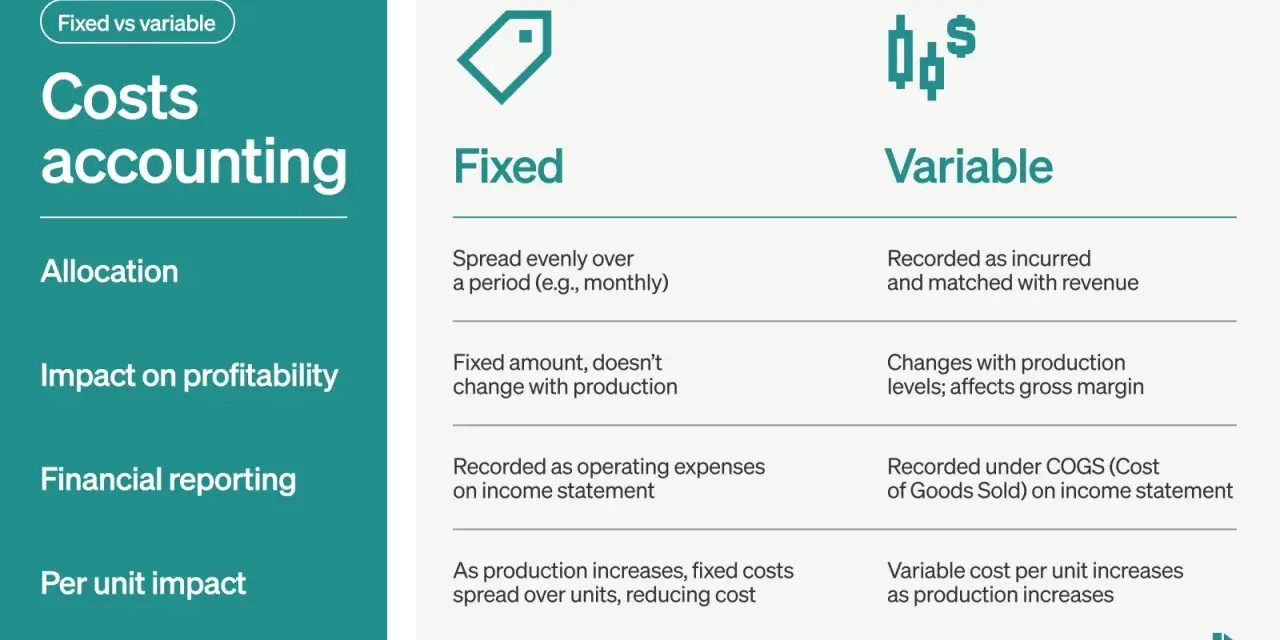
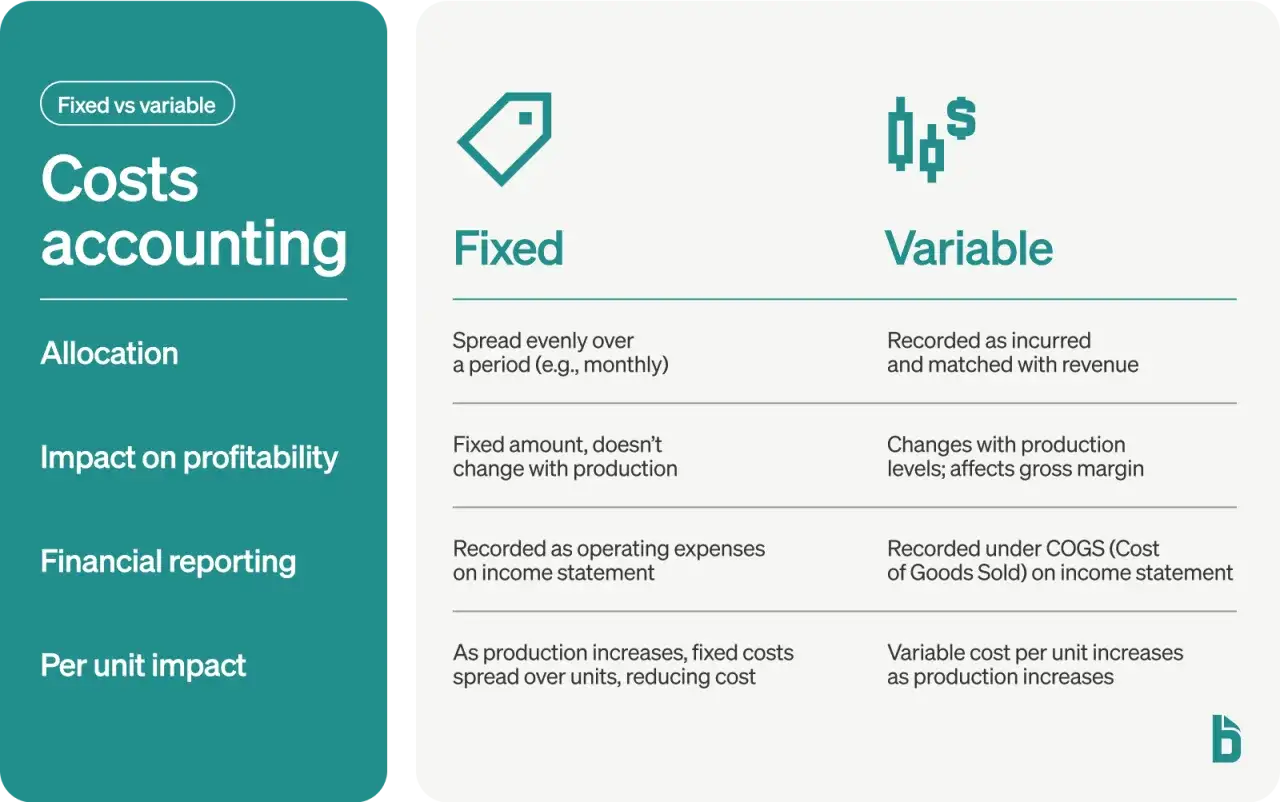
In accounting, I think the cleanest way to separate costs is by behavior, not by intuition. A fixed cost is an expense that does not change just because you make one more unit, serve one more client, or ship one more order, at least within the relevant range where your assumptions are valid. A variable cost, by contrast, moves with activity: more output usually means more cost, and less output usually means less cost.
That sounds simple until you remember one important detail: fixed does not mean permanent. Rent can be fixed for this lease term and then change at renewal. Salaries can stay flat until headcount changes. Variable costs are also not magically unstable in every direction; they usually follow a clear driver, such as units produced, hours worked, or transactions processed. Once you frame costs this way, the rest of the comparison becomes much easier to use in practice.
The practical question I always ask is this: what actually causes the expense to move? That question leads directly into examples, which is where the distinction becomes far less abstract.
Typical examples and how they show up in a business
Most readers do not need another textbook definition. They need to know what belongs in each bucket and where businesses often misclassify costs. The table below is the version I would use when reviewing a small business budget or a management report.
| Cost behavior | Fixed costs | Variable costs |
|---|---|---|
| How they move | Stay mostly flat within the relevant range | Change as output, sales, or activity changes |
| Common examples | Rent, base salaries, insurance, subscriptions, depreciation | Raw materials, packaging, commissions, hourly production labor, outbound freight |
| What to watch | Renegotiation dates, staffing changes, contract resets | Volume spikes, supplier price changes, overtime, usage-based billing |
| Typical mistake | Assuming “fixed” means it will never change | Assuming every cost tied to sales is purely variable |
In real businesses, the gray areas matter. A salaried production supervisor is usually treated as fixed in the short run, while piece-rate labor is variable. A cloud platform may include a flat subscription plus usage charges. Utilities can have a base fee and a usage component. That is why I prefer to classify each expense by its main driver rather than forcing everything into an overly neat label.
Once you can see the examples clearly, the next question is whether the split actually changes decisions. It does, and often more than people expect.
Why the distinction changes pricing, budgeting, and break-even
This is where accounting becomes strategy. If I know the fixed cost base, I know how much revenue must arrive before the business even starts to cover overhead. If I know the variable cost per unit, I know how much each additional sale actually contributes. Together, those numbers shape pricing, hiring, inventory, and expansion plans.
The basic break-even formula is straightforward:
Break-even units = Fixed costs ÷ Contribution margin per unit
Contribution margin per unit is the selling price minus the variable cost per unit. So if a product sells for $50, variable cost is $20, and fixed costs are $90,000, the contribution margin is $30. Break-even is 3,000 units. Every unit above that point contributes to profit, which is why high fixed-cost businesses can scale quickly once volume is strong, but also feel pressure faster when volume slips.
That tradeoff is often described as operating leverage, meaning the degree to which fixed costs amplify profit changes as sales move. A business with higher fixed costs can become very profitable when demand is strong, but it also carries more downside when demand softens. A variable-heavy model is usually easier to flex down, but margins can be squeezed more directly by input inflation or price pressure.
For budgeting, I like to separate volume risk from rate risk. Volume risk tells you how many units or orders you need. Rate risk tells you how much each unit costs to make or serve. Once that distinction is clear, the messy middle becomes the next thing to handle.
The messy middle of mixed and step costs
Not every expense behaves like a pure example from an accounting workbook. In practice, many costs are mixed, or they move in steps rather than smoothly. I see this most often in utilities, telecom plans, software, logistics, and labor.
Mixed costs
A mixed cost has both a fixed base and a variable component. A phone plan might charge a monthly base fee plus overage charges. A warehouse utility bill may have a standing charge plus usage-based consumption. A sales team might have salaries plus commissions. For planning, I usually separate the two pieces when the amount is material enough to affect pricing or margin decisions.
Read Also: U.S. GAAP Impairment - Avoid Costly Mistakes
Step costs
Step costs stay flat until activity crosses a threshold, then they jump to a new level. Hiring a second shift supervisor, adding another server cluster, or leasing a larger storage unit are all good examples. They are not purely fixed, because they do change, but they do not rise smoothly with every additional unit either. If you ignore the step, your forecast can look stable right up until it suddenly is not.
This is the part that trips up simplified models. If a cost has a base charge, a usage charge, or a threshold jump, I would rather model it honestly than force it into a tidy category that hides the real behavior. That leads naturally to the question of how to classify costs in a way that is useful, not just neat on paper.
How to classify a cost without guessing
When I review a cost, I usually work through a short sequence rather than relying on labels from last year’s budget. The goal is to understand the driver, the time horizon, and the size of the cost relative to the business.
- Identify the driver. Ask what actually moves the expense: units produced, orders shipped, customers served, labor hours, or something else.
- Check the time frame. A cost can be fixed in the short run and variable in the long run. Lease payments, salaried labor, and contracts often change only when a term ends.
- Separate base and usage if needed. If an invoice has both a flat fee and a usage fee, model both pieces instead of collapsing them into one line.
- Compare actual data over several periods. Three to six months of invoices, payroll, and volume data usually reveal whether the cost behaves as expected.
- Document the assumption. If you treat a cost as fixed, write down the reason and the range of activity where that assumption is valid.
I also pay attention to whether the cost is material. If the difference between treating something as fixed or variable barely moves the forecast, I do not over-engineer it. But if it affects pricing, staffing, or cash planning, I want the classification to be defensible.
That leads to the last piece: a practical rule set that keeps the numbers useful when they move from accounting theory into actual decision-making.
The rule set I use before I trust the numbers
When I want a cost model that will survive real business conditions, I use a few rules that are simple but effective:
- Start with behavior, not category names. A label is less useful than knowing what causes the cost to move.
- Use the relevant range. Do not assume a cost stays stable outside the output level where the pattern was observed.
- Keep mixed costs split when the amounts matter. One blended line can hide a lot of decision-making value.
- Test assumptions against actual activity. If sales, orders, or production changed and the cost did not behave as expected, revise the model.
- Use contribution margin for pricing decisions. Revenue alone can look healthy while margin quietly weakens.
That is usually enough to avoid the most expensive mistakes: underpricing a product, overcommitting to fixed overhead, or assuming a cost is more flexible than it really is. In accounting, the best cost classification is not the prettiest one; it is the one that matches how the business actually operates and gives you a forecast you can trust.