Gross margin is one of the first numbers I check when I want to know whether a business is pricing correctly and controlling its direct costs. This article breaks down what the percentage really measures, how to calculate it from revenue and cost of goods sold, and how I interpret it alongside other profit measures. I’ll also show where the number can be distorted by inventory policy, cost classification, or a sloppy comparison with the wrong peer group.
The essentials at a glance
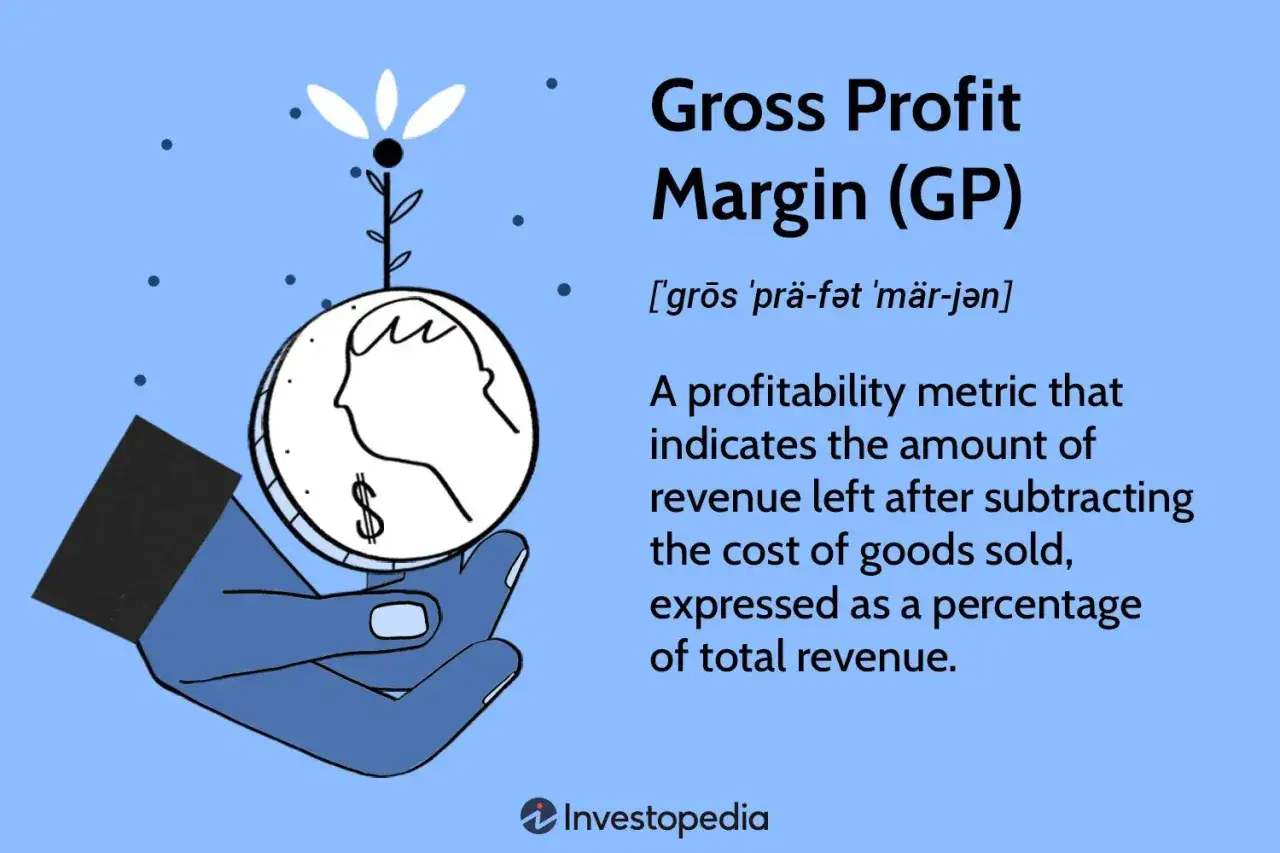
- It measures how much of sales remains after direct production or acquisition costs.
- The calculation uses net sales and direct costs, not operating expenses.
- A higher percentage usually signals better pricing power or tighter cost control, but context matters.
- Inventory method, product mix, and cost classification can move the number materially.
- Compare businesses only when the model and accounting treatment are broadly similar.
What the number actually tells me
I treat it as the first profitability layer on the income statement. It tells me how much of each sales dollar is left after the costs needed to make or buy the product have been paid, but before rent, salaries, marketing, interest, and taxes enter the picture.
That makes it a useful check on pricing discipline and purchasing efficiency. In manufacturing, the direct costs may be raw materials, direct labor, and factory overhead. In retail, the focus is usually on inventory purchase cost and related acquisition costs. In software or services, the label often changes to cost of revenue, because the direct cost structure is different.
- Included: direct materials, direct labor, and other costs directly tied to the good or service sold.
- Usually excluded: sales and marketing, general administration, interest, and income taxes.
- Interpretation: a stronger percentage means more room to cover overhead and still produce earnings.
Once that is clear, the next step is to calculate it in a way that does not blur the line between direct and indirect costs.
How I calculate it step by step
The formula is simple: gross profit margin = (revenue - cost of goods sold) / revenue × 100. If revenue is $500,000 and COGS is $320,000, gross profit is $180,000 and the margin is 36%.
| Line item | Amount | Why it matters |
|---|---|---|
| Revenue | $500,000 | Starting point before direct costs |
| COGS | $320,000 | Direct cost tied to the sale |
| Gross profit | $180,000 | Revenue minus COGS |
| Gross profit margin | 36% | $180,000 ÷ $500,000 |
Two details matter more than most people expect. First, use net sales if the business reports returns, discounts, or allowances separately. Second, if revenue is zero, the ratio is undefined, so a business in startup mode or shutdown mode needs a different lens.
I also watch the terminology. Some companies use cost of revenue rather than COGS, especially in services and software. The label is different, but the calculation is still the same idea: what remains after direct cost of delivery.
From there, the real question is why the percentage moved in the first place.
What moves the ratio in real businesses
The biggest drivers are usually not mysterious. They are pricing, mix, input cost, and accounting policy. If the number jumps or falls, I look for one of these before I assume the business itself changed.
- Pricing and discounts: a price increase can lift the percentage quickly, but deep promotions, rebates, or channel discounts can pull it down just as fast.
- Product mix: a company may sell more of a high-margin product line one quarter and more low-margin volume the next; the blend changes the ratio even if total sales rise.
- Supplier terms and inventory costs: better purchasing, volume rebates, or lower freight-in costs can improve the result. Rising raw materials or labor costs do the opposite.
- Inventory accounting: FIFO, LIFO, and weighted average can produce different COGS in inflationary periods, so two similar companies can report different margins for reasons that are partly accounting-driven.
- Cost classification: if direct costs are reclassified into operating expenses, the percentage looks cleaner than the economics really are. I’m especially alert to that in service and software businesses.
One useful rule of thumb is this: if management explains a change only with “market conditions,” I keep digging. Usually there is a more specific cause hiding underneath, such as a mix shift, a supplier reset, or a pricing decision made earlier in the year.
That is also why I never stop at this one ratio. The next comparison puts it in context.
Gross profit, operating profit, and net profit are different signals
A margin metric only becomes useful when I know which layer of the income statement it belongs to. The first level is direct cost efficiency; the next is overhead efficiency; the last is what the business keeps after everything else.
| Metric | Formula | What it includes | What I use it for |
|---|---|---|---|
| Gross profit margin | (Revenue - COGS) / Revenue | Direct production or acquisition cost | Pricing power and production efficiency |
| Operating margin | Operating income / Revenue | SG&A, R&D, depreciation, and other operating costs | Whether overhead is under control |
| Net margin | Net income / Revenue | Interest, taxes, and all remaining items | Final bottom-line performance |
| Markup | Gross profit / COGS | Cost base, not revenue | Pricing on top of cost |
The markup row is there because people confuse it with margin all the time. Margin is measured against revenue; markup is measured against cost. A product with a 40% gross profit margin has a 66.7% markup, which is the kind of detail that can derail a pricing conversation if nobody defines terms up front.
For a board, investor, or lender, that distinction matters. A business can show a decent gross profit margin and still fail if overhead is bloated or debt service is heavy. That is why I always move one layer deeper after I read the first number.
Mistakes that distort the number
The most common errors are not mathematical. They are classification errors. If the inputs are wrong, the percentage will look precise and still be misleading.
- Mixing up gross profit and gross profit margin: one is a dollar amount; the other is a percentage.
- Using revenue instead of net sales: returns, allowances, and discounts can make the denominator too high if they are ignored.
- Putting indirect expenses into COGS: rent, admin salaries, marketing, and finance costs usually belong below the gross line, not inside it.
- Comparing across unlike businesses: a distributor, a manufacturer, and a software company can have very different cost structures even when they sell similar revenue amounts.
- Judging one quarter in isolation: seasonality, inventory build, or temporary promotions can make the ratio swing in ways that do not reflect the underlying trend.
- Ignoring one-off inventory issues: obsolescence reserves, write-downs, and shrinkage can compress the percentage without changing the core business model.
If I suspect an earnings-quality issue, I want the accounting policy note and the management discussion, not just the headline percentage. A clean ratio still has to be earned with clean inputs.
That leads directly to how I use the figure in real decisions, where the practical value is much higher than the label on the statement.
How I use it in pricing, budgeting, and board-level decisions
When I use the metric in practice, I am usually trying to answer one of four questions: can we raise prices, can we absorb a supplier increase, is the product mix improving, and is the business creating enough room for overhead?
- Pricing: I test whether a discount can be justified by volume or whether it is just leaking value.
- Budgeting: I model raw-material inflation, labor pressure, and freight changes before they hit the forecast.
- Contracting: I look at supplier agreements, rebate clauses, and minimum-volume commitments because contract terms often shape the percentage more than people expect.
- Portfolio decisions: I ask whether low-margin SKUs or service lines deserve to stay in the mix or should be redesigned.
My rule is simple: if a decision changes the direct cost base, it changes the margin, and it changes cash flow expectations later in the year. That is why the ratio belongs in strategic planning, not just month-end reporting.
To use it well, though, I still need to check whether the reported number is apples-to-apples with prior periods and peers.
What I check before I trust the number
Before I act on a reported percentage, I ask four things: did the company change inventory method, did management reclassify direct costs, are returns or write-downs unusually high, and am I comparing the same period last year or a seasonal peak with a seasonal low?
- Use the same accounting basis across periods.
- Check whether the business changed product mix or channel mix.
- Read the footnotes if the company presents an adjusted version of gross profit or margin.
- Compare with peers that sell through the same model and face similar direct costs.
When those checks line up, the percentage becomes a sharp diagnostic tool. When they do not, I treat it as a starting point rather than a conclusion, because the real story is usually in the classification choices and the operating model behind the line.