Financial decisions improve when you know which numbers help you steer and which numbers only confirm where you have already been. The real difference between leading vs lagging indicators is timing: one set helps forecast pressure or momentum, while the other proves whether a strategy actually worked. In business finance, using only backward-looking metrics can make a dashboard look tidy while hiding problems that are already building underneath.
Predict with one set of metrics and confirm with another
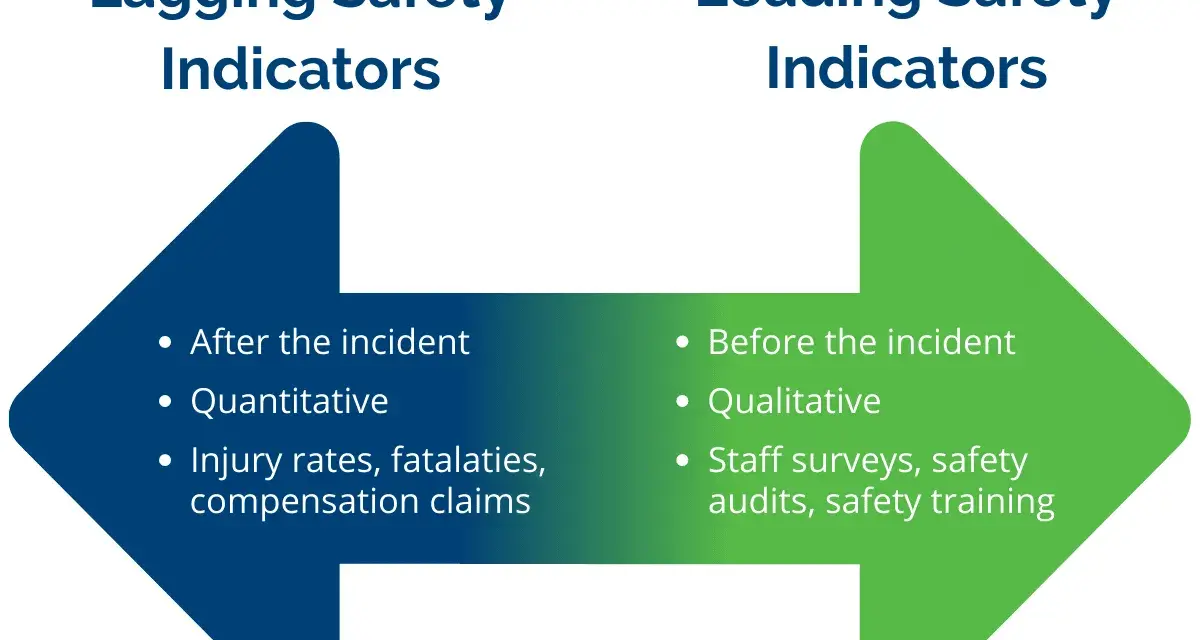
- Leading metrics are early signals. They help you spot a shift before it shows up in revenue, margin, or cash.
- Lagging metrics are outcome measures. They show what already happened and are useful for reporting, accountability, and incentives.
- The same metric can change role depending on the decision you are trying to make.
- Strong finance dashboards connect drivers, outcomes, and review cadence instead of dumping every KPI into one screen.
- A small set of reliable early signals plus a smaller set of confirmed results usually beats a long list of noisy metrics.
How I separate early signals from scorekeeping
I treat leading metrics as steering data and lagging metrics as scorekeeping data. Steering data changes soon enough to influence a decision; scorekeeping data tells you whether the decision paid off. That distinction matters because finance teams often confuse activity with progress, especially when a dashboard is full of numbers but short on interpretation.
Leading signals are usually tied to behavior that comes before a financial result: sales pipeline coverage, proposal conversion rate, customer usage, invoice dispute volume, or the pace of budget consumption. Lagging measures are the results that eventually land in the books: revenue, gross margin, EBITDA, net income, free cash flow, collections, churn, and bad debt expense. Neither category is automatically better. The useful question is whether the metric still leaves you enough time to act.
- Leading examples: qualified pipeline, order backlog, renewal risk, average days to invoice, and budget burn rate.
- Lagging examples: booked revenue, operating margin, cash balance, DSO, churn, and quarter-end profit.
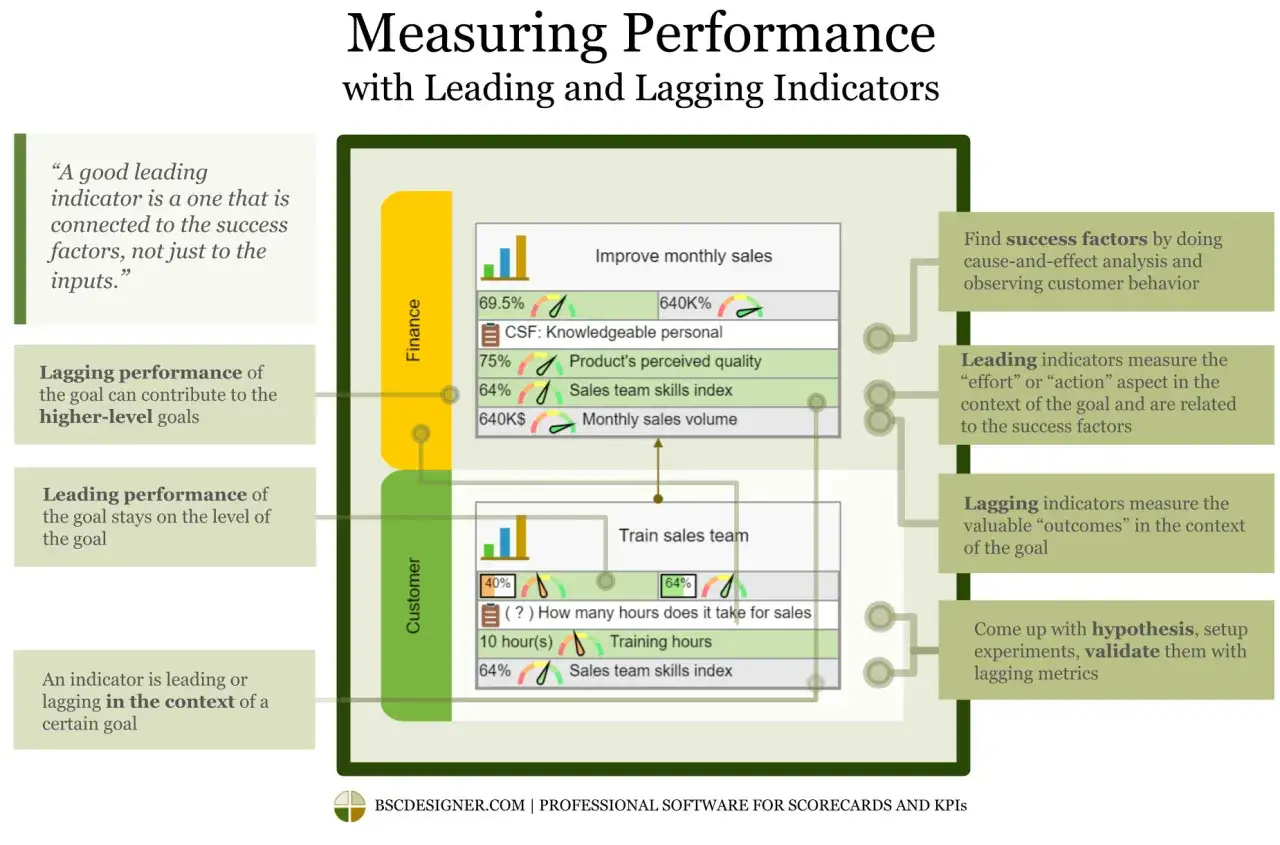
- Context matters: a number can be leading for one decision and lagging for another.
That context is what turns a simple metric into a management tool, which is exactly why finance dashboards need more structure than a basic KPI dump.
Where they fit in a finance dashboard
In practice, I like to map metrics to the decisions they support. A CFO does not need the same dashboard as a sales leader, and a board packet should not look like an operations screen. The point is to connect early warnings with final outcomes so each audience gets the level of certainty it needs.
| Finance area | Leading signal | Lagging result | What it helps answer |
|---|---|---|---|
| Revenue | Pipeline coverage, stage conversion, win rate, average sales cycle | Booked revenue, ARR, realized revenue | Will the quarter close short or on target? |
| Cash and collections | Invoice delays, dispute counts, overdue account trend | DSO, ending cash, bad debt expense | Is liquidity tightening before the cash balance moves? |
| Cost control | Hiring pace, overtime hours, vendor request growth, budget burn rate | SG&A, operating margin, total expense ratio | Are costs drifting before the month closes? |
| Customer health | Product usage, support volume, renewal activity, expansion interest | Churn, net revenue retention, renewal revenue | Will the customer base hold up? |
| Governance and risk | Policy exceptions, overdue approvals, control failures | Audit findings, losses, penalties | Are controls breaking before the issue becomes public? |
This is where governance matters. A lagging metric can show whether management delivered; a leading metric shows whether management is still on track. If you only report results after the fact, you are managing with hindsight, not control.
Why the comparison matters for forecasting and accountability
The practical value of predictive metrics versus historical performance metrics is not academic. It changes how quickly a company can respond to risk. A metric that arrives too early can create noise and false alarms. A metric that arrives too late can create false confidence. I have seen both problems in real finance teams: one overreacts to weak signals, and the other waits for the month-end close before admitting the trend already turned.
| Dimension | Leading metrics | Lagging metrics |
|---|---|---|
| Timing | Earlier, faster-moving, often updated weekly or daily | Later, more stable, often reported monthly or quarterly |
| Actionability | High when there is still time to change the outcome | Higher for review and accountability than for intervention |
| Accuracy | Less precise on timing, more exposed to noise | More reliable for confirming what already happened |
| Best use | Forecasting, scenario planning, operational steering | Board reporting, compensation, audit trails, performance review |
I usually think of the two as a pair, not a contest. Leading measures help you decide what to do next; lagging measures tell you whether the plan deserved to work. A balanced scorecard follows the same logic: the driver matters, but the result still has to be visible.
How I build a metric stack that drives decisions
The cleanest dashboards start with a decision, not with a data feed. If the question is, “Should we slow hiring?” or “Do we need to tighten credit terms?” then the metric set should be built around that decision. I do not start with the spreadsheet. I start with the action.
- Define the decision. Be specific about what has to change if the metric moves.
- Choose one outcome metric. This is usually lagging and should reflect the financial result you ultimately care about, such as cash flow, margin, revenue, or churn.
- Select two to four drivers. These are the earlier signals that influence the outcome, such as pipeline coverage, invoice aging, or renewal activity.
- Set a cadence and threshold. Weekly driver reviews and monthly or quarterly outcome reviews are often more useful than one generic monthly dashboard.
- Assign an owner and an action. Every metric should trigger a decision, a conversation, or a correction.
A simple cause-and-effect map, often called a driver tree, helps here. It shows how operational actions flow into financial results. If the chain is fuzzy, the metric is probably decorative. If the chain is clear, the dashboard becomes a management tool instead of a reporting artifact.
Common mistakes that make finance metrics misleading
The biggest problem I see is not a lack of data. It is poor metric design. Teams either track too many numbers, or they track the right numbers at the wrong level. Both approaches make it hard to see what matters.
- Counting activity as progress. More sales calls, more invoices, or more meetings do not matter if conversion stays flat.
- Using lagging results as controls. Revenue, profit, and cash are essential, but they do not help you intervene early enough on their own.
- Overloading the dashboard. A dozen weak signals usually create noise, not clarity.
- Ignoring seasonality and reporting lag. Retail, services, payroll, and collections all move on different clocks, so one metric cadence will not fit everything.
- Leaving no owner behind the number. If nobody is responsible for the response, the metric is just decoration.
- Mixing strategic and operational questions. A board needs a different level of detail than a controller or a credit manager.
When a metric starts being gamed, it usually means the number is being used to reward behavior without enough context. That is a governance problem as much as a reporting problem.
A simpler way to choose the right metric for the job
My rule is straightforward. If I need to act this week, I want a leading metric. If I need to judge the quarter, I want a lagging metric. If the decision has meaningful financial downside, I want both. That combination gives leaders enough warning to respond, enough proof to stay disciplined, and enough structure to avoid gut-feel management.
For business finance, that is the real lesson. Use early signals to steer, use confirmed results to verify, and keep each metric tied to a decision someone actually owns. When the dashboard works that way, it stops being a report and starts becoming part of the operating system.